Even Many “Affluent” Americans Live Primarily on Their Own Labor
Let’s talk reality. The majority of Americans – including those who own small businesses – work for a living. They sell used cars, repair plumbing, work in home improvement. They are doctors, nurses, dentists, attorneys, and real estate agents.
While professionals who own practices (doctors, dentists, attorneys, etc.) do earn more they also have much higher expenses so they often end up with even less disposable income than other small business owners.
Those who can not tell that there is no recovery have no idea how the majority of Americans who claim to be middle class – but never really were – actually live. They do not know what they do with their money and time.
This post is intended as a wake-up call for people at all income levels
because they definitely need a reality check.
Note that in the next section these stats are for median household income. I point that out because in many cases more than one person’s income has been included. Most often in America today, it takes at least two incomes – and many of these people have many more than that – to earn these amounts.
Median US Household Income
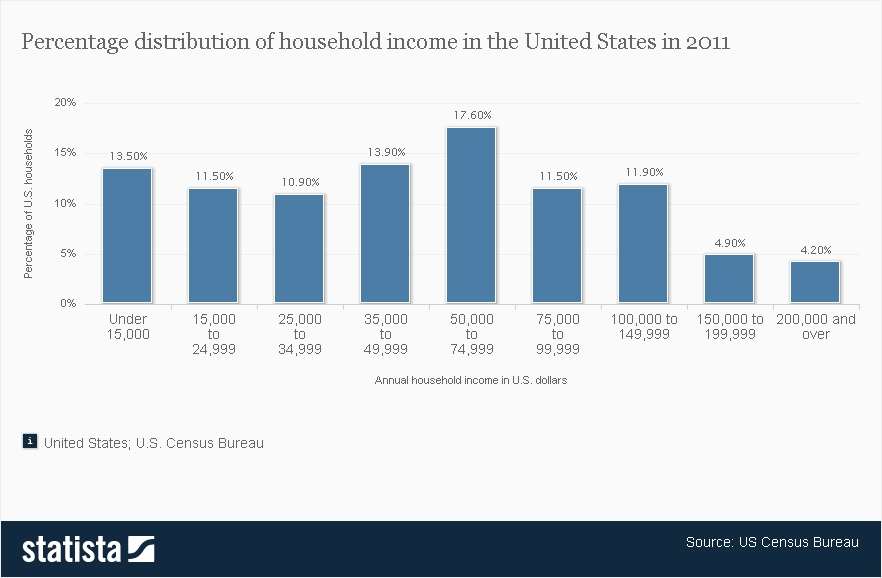
“According to the Census ACS survey, the median household income for the United States was $50,502 in 2011, the latest data available. 2012 Census ACS data (including 2012 national household income numbers) will be released in September of 2013. Median family income and per capita income for the United States are shown further down.” 
[Above data from Department of Numbers U.S. Household Income.]
For all those who tuned out during their math classes, the median is the point where half fall above and half fall below. What that means is that half of all American families (not individuals – the entire family) earn less than $50,502 per year (as of 2011 and that is likely to have declined).
That includes Americans who own small businesses.

Some Small Business Owners Do Not Even Use Banks
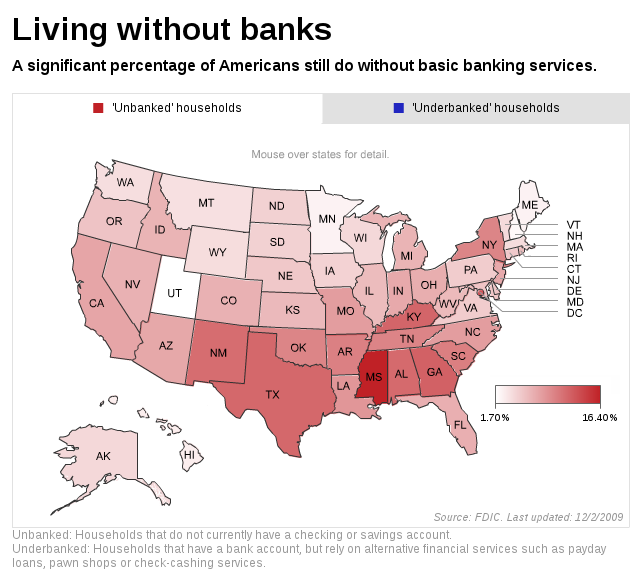
This map links to a live interactive version showing what percentage of Americans do not use banks. I hope those reading this will comment on what they found most surprising about the information in this post.
I suspect many have no idea that almost 10% of people in New York and 11.7% in Texas do not use banks. Many more have some kind of account, but also use pawn shops, check cashing services, or cash checks they receive from employers or work completed at grocery and retail stores.

The source of the chart above is a good example of why you should be wary of what Mark Twain referred to as “Lies, Damn Lies, and Statistics”. Why does the 2009 version indicate there were”
“17 Million Americans with No Bank Accounts, but the 2011 version displaying the same kind of map published on the same site claims: “Nearly 10 million households across the country are living without a bank account…
…the national unbanked rate has risen from 7.7% in 2009 to 8.2% in 2011, meaning one in 12 households are now without bank accounts.”
Why did the 17 million figure get dropped to “nearly 10 million” when they claim the number has risen – not dropped?
The only truly affluent are those who do not want
more than they have. ~ Erich Fromm ~
AVERAGE COST OF LIVING
Even those who still have decent paying careers and believe they are middle class are in for a rude surprise: inflation is going to eat their lunches. Their buying power will continue to decline as I explained in WARNING to Small Businesses Targeting Affluent Markets.
Consider these averages:
San Francisco
- Median house payment SF $2,558 per month = $30,396 per year
- Average rent SF $2,106 / mo = $25,272 / yr
- San Francisco, Ca average salary is $76,686, median salary is $70,000 with a salary range from $19,947 to $1,300,000. San Francisco, California salaries are collected from government agencies and companies. Source: Salary List San Francisco Salaries and Jobs
Chicago
- Median mortgage payment Chicago ?
- Average rent Chicago $1,726 / mo = $20,712
- Chicago, Il average salary is $64,141, median salary is $56,000 with a salary range from $20,855 to $1,820,000. ~ Source: Salary List Chicago, Illinois Jobs
Dallas
- Median house payment Dallas ?
- Average rent Dallas $1,210 / mo = $14,520
- Dallas, TX average salary is $60,621, median salary is $53,328 with a salary range from $18,924 to $1,320,144. ~ Source: Salary List Dallas, Texas Salaries and Jobs
New York City
- Median mortgage payment NYC $2,069 / mo = $24,828 /yr
- Average rent NYC $2953 / mo = $35,436 /yr
- New York, NY average salary is $79,373, median salary is $62,400 with a salary range from $19,843 to $2,029,124. ~ Source: Salary List New York, NY Job Openings
Los Angeles
- Median home payment LA $1,475 / mo = $17,700 / yr
- Average rent LA $1,552 / mo = $18,624 /yr
- Los Angeles, CA average salary is $56,001, median salary is $46,467 with a salary range from $20,544 to $1,984,320. ~ Source: Salary List LA, CA Positions Available
Note the amounts in bold. Those are actual jobs paying those amounts that were listed on that site. Few realize there is no minimum wage in multiple U.S. states (Alabama, Louisiana, Mississippi, South Carolina, Tennessee) and is only $2 an hour in Oklahoma, and $4 in Montana.
The Federal Minimum wage is some states is as low as $5.15 an hour and as high as $9.19. Even at $9.19 x 40 hours = $367.60 per week and about 4.5 weeks per month = $1654.20 per month. Even with two incomes,
And many no longer get 40 hours as companies strive to eliminate full time employment and benefits by using contractors, consultants, or reducing employee hours below full time. Obamacare further incentivizes the elimination of full time jobs.
There IS a solution: buying local and supporting small businesses. Corporations have moved manufacturing overseas, and even though insourcing is bringing some of it back, the pay will be lower and benefits non-existent because the union contracts have been removed.
We need to understand that we can not maintain our “middle class” standard of living by going into debt and salaries have not kept up with inflation. The only way we will be able to survive is to change our lifestyles and return to slow growth without debt.


